I spend the majority of my time working in Microsoft Power BI, and as part of the data modeling, I often find myself wanting a custom calendar table beyond the natively generated ones.
Calendar Scripts: Daily | Hourly
Using DAX (Data Analysis Expressions) in SSAS (SQL Server Analysis Services) 2016, Excel 2016 or recent Power BI releases, there are two functions that mean I no longer need to keep a calendar table elsewhere to bring into the model. With older versions I would reference a database table storing this, or an Excel file with the content created.
These new functions are CALENDAR and CALENDARAUTO, both of which create a single column of dates.
Calendar will run between the dates specified, while CalendarAuto looks through your entire model to find the earliest and latest date for which it needs to generate dates. Unfortunately however, this doesn't give you all the ways you may want to slice and dice your date dimension, and so I created a table script for a daily and hourly date table that I've used across many models I've built.
By default I use CALENDERAUTO as I want whatever range my data covers. If there was a specific range of dates to be specified instead, then you would replace CALENDARAUTO() with CALENDAR(<start date>,<end date>), which can thankfully be calculations rather than just dates you've specified.
⚠ Note: Unless you are an advanced user, calendar should be specified with a complete year as this may otherwise break Time Intelligence. That would look like:
CALENDAR(DATE(startyear,1,1), DATE(endyear,12,31))
How to Use
To use these scripts, you will need to be able to define a table for use in your model. The example below is in Microsoft Power BI, but this should work with 2016 Excel or SSAS as well.
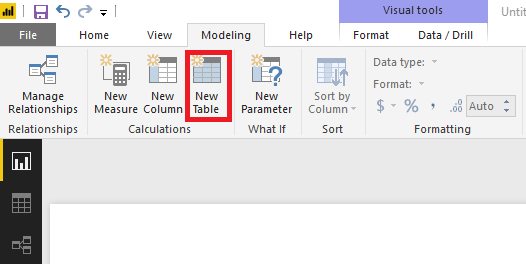
In Power BI, on either the Report or Data View, click on the Modeling Tab at the top, and choose New Table. This will create a new table based on any DAX function which returns a table.

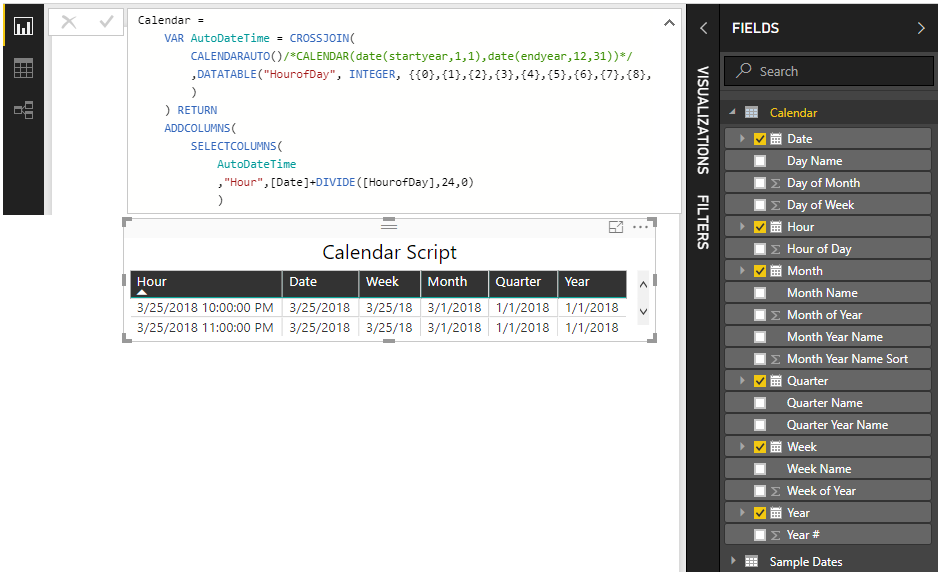
This should open a new formula bar window, in which you can copy the script below, and paste it into the window. Once you enter the new script, a table will be added to the fields list below called Calendar.

Once you've added the table, there are some additional steps you'll want to take for a polished result.
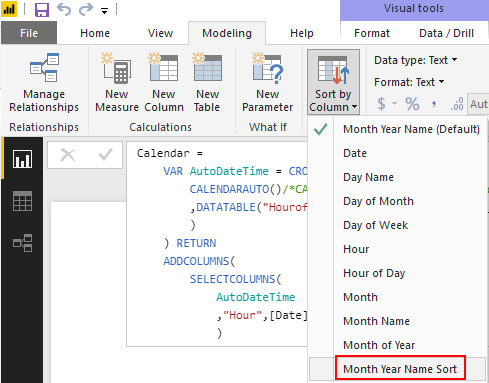
- Sort the columns that are not already ordered
- Day Name by Day of Week
- Month Name by Month of Year
- Month Year Name by Month Year Name Sort
- You probably also want to hide the Month Year Name Sort once you've sorted it as it's meant for visual purposes only. This can be done by right clicking on the field in the Field List and choosing hide. To see hidden items, you can also right click and view hidden to see it during development, but not expose it to end users.
- Week Name by Week

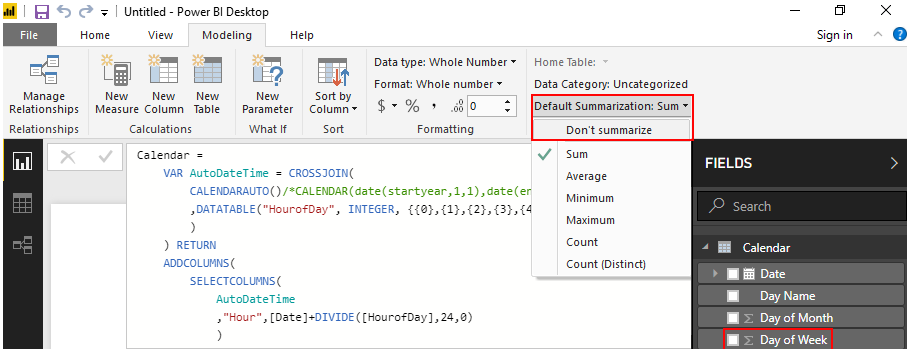
- Change the Default Summarization for numbers like Day of Week. By default when you bring it into a report it will aggregate as a sum, when really it should be used as categorical data.

- Rename the fields, or hide additional ones as appropriate to your audience. This script is meant as a starting point, but I often need to customize this beyond what is already done to help provide meaningful insights.
The next steps in making use of this Calendar table would be relating it back to your other tables in the Relationships view, but I'll leave this as an exercise for the reader now and an opportunity to explore Date relationships in DAX in another update.
Calendar =
	ADDCOLUMNS(
		CALENDARAUTO() /*CALENDAR(date(startyear,1,1),date(endyear,12,31))*/
		,"Day Name",FORMAT([Date],"DDDD")
		,"Day of Week",(WEEKDAY([Date],1))
		,"Day of Month",DAY([Date])
		,"Week",DATE(YEAR([Date]),MONTH([Date]),DAY([Date]))-(WEEKDAY([Date],1)-1)
		,"Week Name", "Week of " & DATE(YEAR([Date]),MONTH([Date]),DAY([Date]))-(WEEKDAY([Date],1)-1)
		,"Week of Year", WEEKNUM([Date],1)
		,"Month", DATE(YEAR([Date]),MONTH([Date]),1)
		,"Month Name", FORMAT([Date],"MMMM")
		,"Month of Year", MONTH([Date])
		,"Month Year Name", FORMAT([Date],"MMM") & " " & YEAR([Date])
		,"Month Year Name Sort",(100*YEAR([Date])+MONTH([Date]))
		,"Quarter",DATE(YEAR([Date]),SWITCH(ROUNDUP(DIVIDE(MONTH([Date]),3,1),0),1,1,2,4,3,7,4,10),1)
		,"Quarter Name", "Q" & ROUNDUP(MONTH([Date])/3,0)
		,"Quarter Year Name", "Q" & ROUNDUP(MONTH([Date])/3,0) & " " & YEAR([Date])
		,"Year", DATE(YEAR([Date]),1,1)
		,"Year #",YEAR([Date])
	)
Calendar =
	VAR AutoDateTime = CROSSJOIN(
		CALENDARAUTO()/*CALENDAR(date(startyear,1,1),date(endyear,12,31))*/
		,DATATABLE("HourofDay", INTEGER, {{0},{1},{2},{3},{4},{5},{6},{7},{8},{9},{10},{11},{12},{13},{14},{15},{16},{17},{18},{19},{20},{21},{22},{23}}
		)
	) RETURN
	ADDCOLUMNS(
		SELECTCOLUMNS(
			AutoDateTime
			,"Hour",[Date]+DIVIDE([HourofDay],24,0)
			)
		,"Hour of Day", HOUR([Hour])
		,"Date",DATE(YEAR([Hour]),MONTH([Hour]),DAY([Hour]))
		,"Day Name",FORMAT([Hour],"DDDD")
		,"Day of Week",(WEEKDAY([Hour],1))
		,"Day of Month",DAY([Hour])
		,"Week",DATE(YEAR([Hour]),MONTH([Hour]),DAY([Hour]))-(WEEKDAY([Hour],1)-1)
		,"Week Name", "Week of " & DATE(YEAR([Hour]),MONTH([Hour]),DAY([Hour]))-(WEEKDAY([Hour],1)-1)
		,"Week of Year", WEEKNUM([Hour],1)
		,"Month", DATE(YEAR([Hour]),MONTH([Hour]),1)
		,"Month Name", FORMAT([Hour],"MMMM")
		,"Month of Year", MONTH([Hour])
		,"Month Year Name", FORMAT([Hour],"MMM") & " " & YEAR([Hour])
		,"Month Year Name Sort",(100*YEAR([Hour])+MONTH([Hour]))
		,"Quarter",DATE(YEAR([Hour]),SWITCH(ROUNDUP(DIVIDE(MONTH([Hour]),3,1),0),1,1,2,4,3,7,4,10),1)
		,"Quarter Name", "Q" & ROUNDUP(MONTH([Hour])/3,0)
		,"Quarter Year Name", "Q" & ROUNDUP(MONTH([Hour])/3,0) & " " & YEAR([Hour])
		,"Year", DATE(YEAR([Hour]),1,1)
		,"Year #",YEAR([Hour])
	)
The Italian Masters of DAX, Alberto Ferrari and Marco Russo of SQLBI, created a much more extensive date table template in Power BI, including the ability to handle financial calendars, that you can find at: https://www.sqlbi.com/tools/dax-date-template. I would strongly encourage anyone who's interested in learning more about DAX check out their site and some of the other tools they've developed.